Archive | Technical Analysis RSS feed for this section

Targa Resources Prtn Units (NGLS) – Added to Watch List for Long Setup

2 May

Added Targa Resources (NGLS) to my watchlist tonight.

The stock has pulled back to the 50 day moving average after hitting an all time high of $49.24 on 4/22. Today’s closing candle shows a potential reversal sitting on the 50 day moving average as well as support at $44.45 . If we open up tomorrow on NGLS stock, I may look to go long with a stop at $44.35 – slightly below the low of yesterday’s candle.

Here is Targa Resources’s stock chart for today:

Targa Resources Stock Chart - May 2, 2013

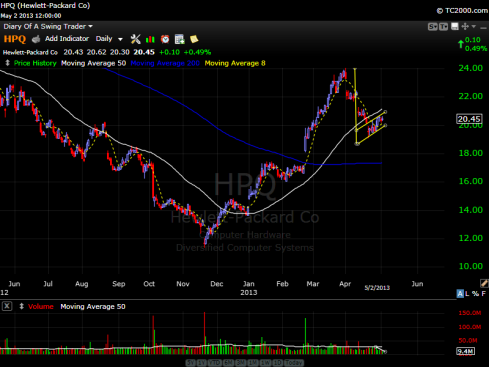
Hewlett-Packard Co (HPQ) Bear Flag Chart Pattern

2 May

Looks like a bear flag on Hewlett-Packard. It is rising on low volume. Beware longs!

Hewlett Packard Stock Chart - May 2, 2013

Halcon Resources Corporation (HK) – Added to watchlist

2 May

Halcon Resources Corporation’s stock took a massive tumble today falling more than 10% intraday. Must have been some bad news.

But, I like the way the day ended with a long wick candle near resistance area. This stock is clearly on a downtrend since it hit it’s high in Feb 9, 2012. But, I’m looking for a nice bounce off resistance.

If the stock opens up early tomorrow, I may go long 500 shares with a stop below today’s closing price. Price target of $6 which is new resistance.

Here is Halcon Resource Corporation’s stock chart today:

Halcon Resources Corporation Stock Chart - May 02, 2013

S&P 500 (SPY) ETF Short Trade Update

2 May

The markets rallied a bit today on some good news. This caused me to get stopped out of my short setup on the S&P 500 yesterday. My stop was at $159.50 and the high for today was $159.89. Looking at the price action, with the high being rejected today and price closing at $159.75, I decided to re initiate my short position. The volume today was low at about 93m shares.

I shorted at $159.80 at around 3:35pm today. I put my stop above today’s high at $160 just to give it some breathing room.

Here is the SPY’s chart today:

S&P 500 Daily Stock Chart

Raymond James Financial (RJF) Long Trade Update

2 May

I didn’t even want to look at this trade yesterday in fear I might get stopped out. But, it came roaring back with the market today. Nothing too exciting though compare to my cost. I was a little indecisive about whether I should take the miniscule profit today since the candle hit up against the 8-day moving average today. I decided to hang on to the position and raise my stop because of the above average volume today. Here is Raymond James Financial’s stock chart today:

Raymond James Financial Stock Chart - 5/2/2013

Tesla Motors (TSLA) Short Trade Update

2 May

Tesla Motor’s (TSLA) stock made a valiant effort for a comeback today but was rejected putting up another nice candle showing bears rejecting its high of $55.27.

The stochastic dipped down below overbought level of 80 today adding additional confirmation more red candles are coming for Tesla Motor’s (TSLA) stock.

I continue to wait this one out looking for at least one big red candle to take some profits.

I tightened my stops today to $55.30 from $55.99 yesterday. Here is Tesla Motor’s stock chart today.

Tesla Motor's Stock Chart on 5/2/2013

Amazon.Com (AMZN) – Long Trade Setup

2 May

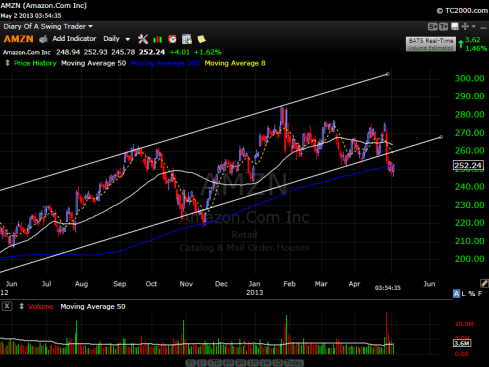
I started a long position in Amazon.com’s (AMZN) stock today based on its price action the last couple of days.

After what was a disappointing earnings report for some investors, Amazon.com’s stock took a nose dive breaking through a major trend line from December 2011. It put out a big red candle on 4/26 and reached a low of $245.75. This happens to be a resistance area from the high of $246.71 on Oct 14, 2011. It also bounced around this resistance area from end of Nov 2011 until middle of 12/17 before a short-lived break out.

The stochastic currently shows oversold and %K and %D are crossing over today which gives me secondary confirmation this might be a short term bottom.

Finally, the price action today suggests a short term reversal so I threw my money in around 9:47am at a price of $250.91.  My target price would be a retest of the trend line from January 2012. My stop is at $245.75. It would make me feel a lot better about this trade if today’s candle breaks above yesterday’s candle’s high and above the 200 day moving average. Here is Amazon’s chart as of right now. The two lines on the chart is the trend from December 2011.

Amazon.Com (AMZN) stock chart

Google (GOOG) Technical Chart Analysis using Elliot Wave Theory

1 May

Google’s (GOOG) chart looks interesting right about now. For those of you who want to go long, you might want to give pause and watch the price action for the next couple of days.

The chart pattern looks a lot like an Elliot Wave with today capping off what might be wave 5. If true, then, wave A, B, C are next and that is a reversal of the uptrend. Yesterday and today may be forming a “lower high” on Google’s stock chart. If there is selling on volume tomorrow or in the next couple of days, I would consider shorting Google’s stock with a stop at 827.80.

Here is Google’s stock chart overlaid with the different phases of the Elliot wave.

Google's stock chart showing an Elliot Wave

S&P ETF (SPY) Short Setup

1 May

The market has had a fabulous run this year so far. There’s a saying though that goes something like “Sell in May and go away”.  I don’t know how true that is over the years, but the S&P 500 looks like a good short opportunity right now after today. The market’s advance seems to be stalling.

The S&P 500 technically has formed a double top chart pattern. On 4/11, the SPY ETF closed at 159.19 with a high of 159.71. Yesterday, 4/30, it put in a similar high at 159.72 and closed at 159.68. Today, the market sold off .88%. The stochastic is in oversold territory and the volume today was above average at 135.8 million shares traded. The closing price of the SPY ETF sits right at the 8 day moving average.

I decided to short 100 shares at 158.92 with a stop at 159.50.

Here is the daily chart showing a double top. I will add to this short if it continues down tomorrow.

The S&P 500 ETF showing a double top chart pattern.

The S&P 500 ETF showing a double top chart pattern.

Tesla Motors (TSLA) Short Stock Update

1 May

Tesla Motors had another distribution day today on average volume. Tesla Motor’s stock dropped 1.41% today. Most of the selling happened in the last minutes of the trading day. Today’s candlestick was not able to break above yesterday’s high and made a lower low today. I tightened my stop to $55.99. I did not take any profit today. Yeseterday, I missed some possible support levels. In today’s Tesla Motors stock chart, I drew lines where possible support might be. The first would be at the 8 day moving average. If the stock touches this moving average, I will take half of my position off the table for a small profit.

TSLA Motors (TSLA) stock chart for 5/1/2013