I started a long position in Amazon.com’s (AMZN) stock today based on its price action the last couple of days.
After what was a disappointing earnings report for some investors, Amazon.com’s stock took a nose dive breaking through a major trend line from December 2011. It put out a big red candle on 4/26 and reached a low of $245.75. This happens to be a resistance area from the high of $246.71 on Oct 14, 2011. It also bounced around this resistance area from end of Nov 2011 until middle of 12/17 before a short-lived break out.
The stochastic currently shows oversold and %K and %D are crossing over today which gives me secondary confirmation this might be a short term bottom.
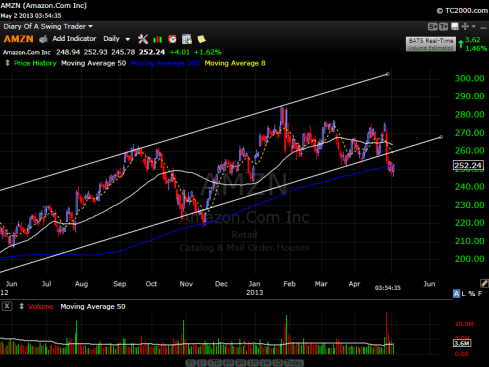
Finally, the price action today suggests a short term reversal so I threw my money in around 9:47am at a price of $250.91. My target price would be a retest of the trend line from January 2012. My stop is at $245.75. It would make me feel a lot better about this trade if today’s candle breaks above yesterday’s candle’s high and above the 200 day moving average. Here is Amazon’s chart as of right now. The two lines on the chart is the trend from December 2011.
Tags: Amazon.com, AMZN, candle stick charts, long trade setup, price action, technical analysis


